Look at the message
Does the headline attract attention, or does an illustration take over?
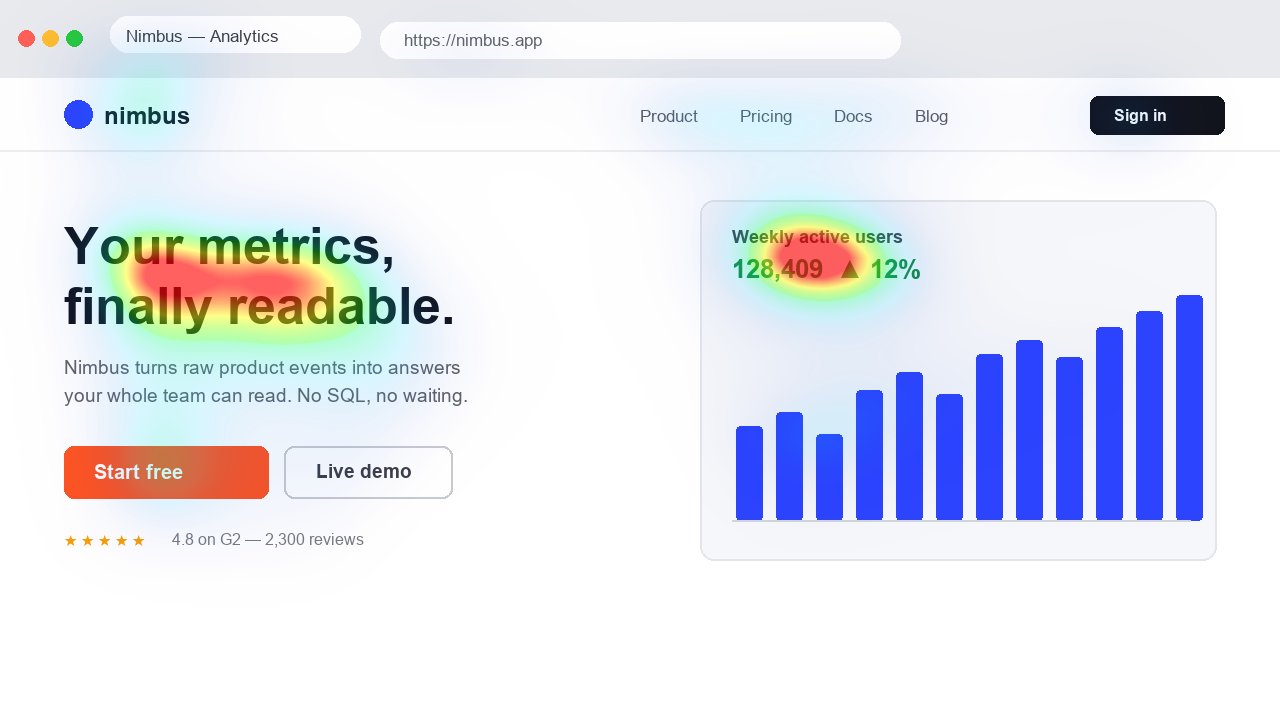
Real-time attention heatmaps, right on the sites you browse. The Chrome extension updates the prediction as you scroll, without leaving the page.
Add Heatpoints to ChromeOr try it on an imageStart with free scans. Email verification follows. Screenshots are processed on the server.
A useful second opinion, wherever you create.
No extension needed for your first look. Drop a landing page, an ad or a thumbnail and explore its predicted attention.
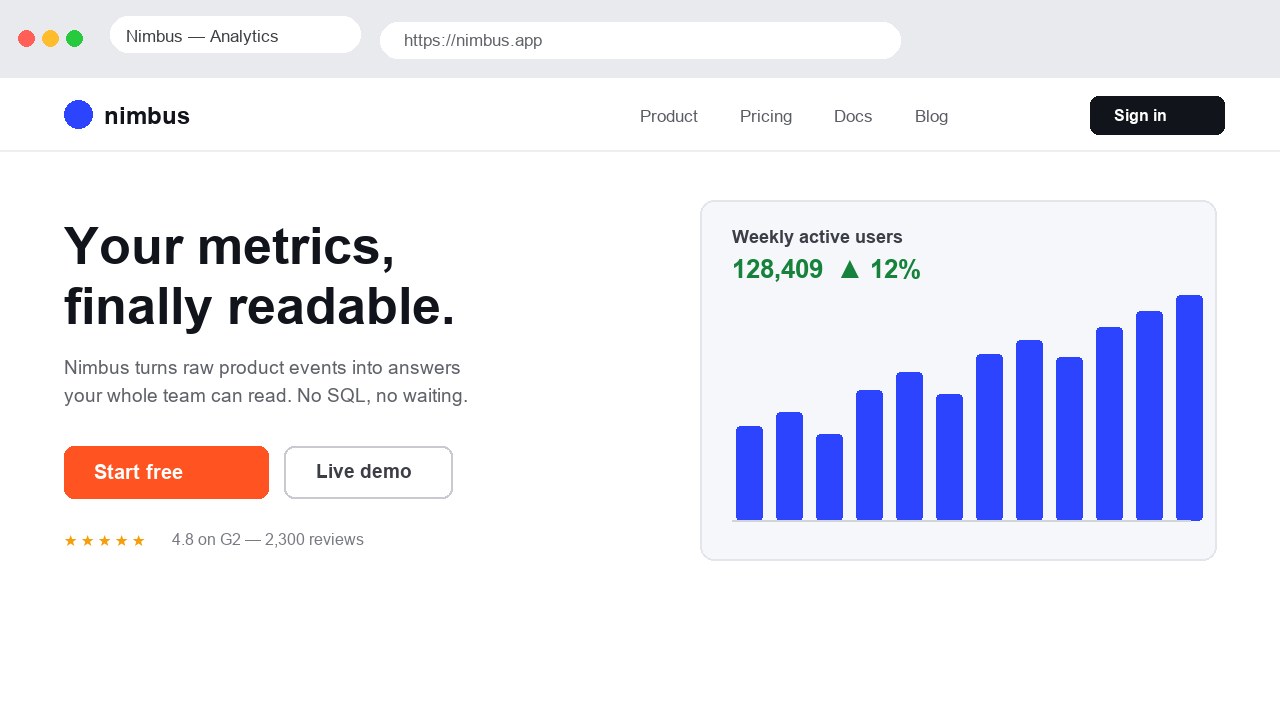
How the Chrome extension worksDemonstration on a fictional page. Heatmap calculated with UNISAL.
Several variants to compare? Drop them all at once, the Championship ranks them.
Fictional sample page analyzed by UNISAL.
Give each design a clear job. Then check whether its visual hierarchy supports it.
A beautiful page can still send attention to the wrong place. Check whether your promise and main action stand out from everything around them.
Test this on my imageBefore you publish, look for…
Start with a screenshot of the first screen, then examine the rest of the page.
The map adds another layer to your review. Warm areas indicate stronger predicted attention. Cold areas invite a question: should something here be easier to notice?
Does the headline attract attention, or does an illustration take over?
A visible button is a design hypothesis to investigate, not a guarantee of clicks.
A warm area is not automatically good. Its value depends on what you want people to notice.
Illustration of the analysis. Open Championship to compare your own variants.
A different crop, a shorter headline, a quieter background. When several versions could work, compare them using the same attention model.
Championship brings your variants together. Use the results to discuss the design, then validate your choice in its real context.
Compare my variantsReview a live website without leaving your browser. The Chrome extension captures the visible page and adds a predicted attention overlay as you explore.
Captures are sent to the server. Email verification follows the initial free scans.
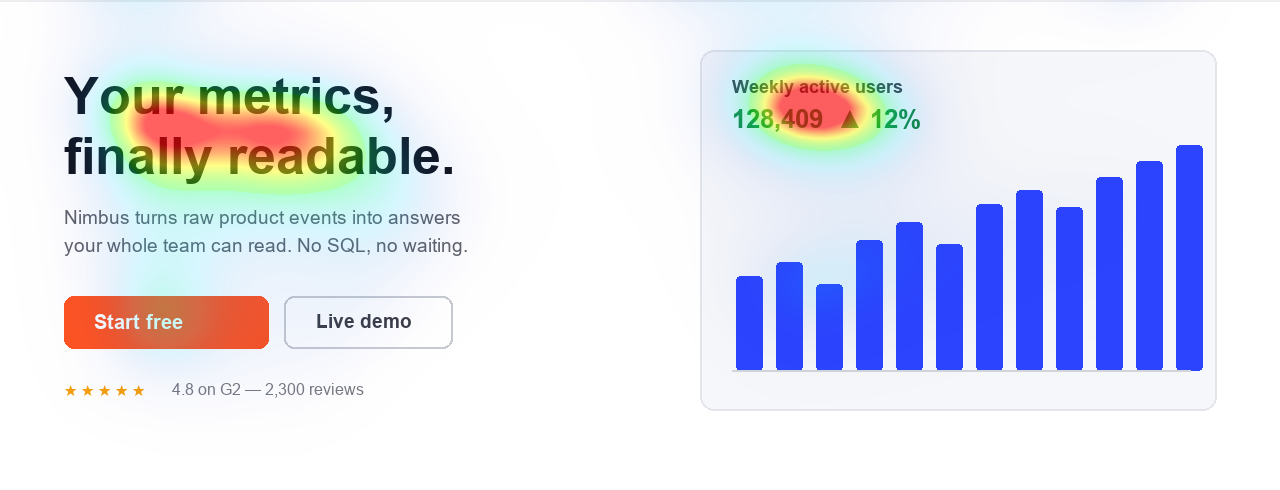
Example prediction. The extension runs on the page you choose.
You already know your design. Make room for a different way of looking at it.
Export a design or take a screenshot. Start with the exact format people will see.
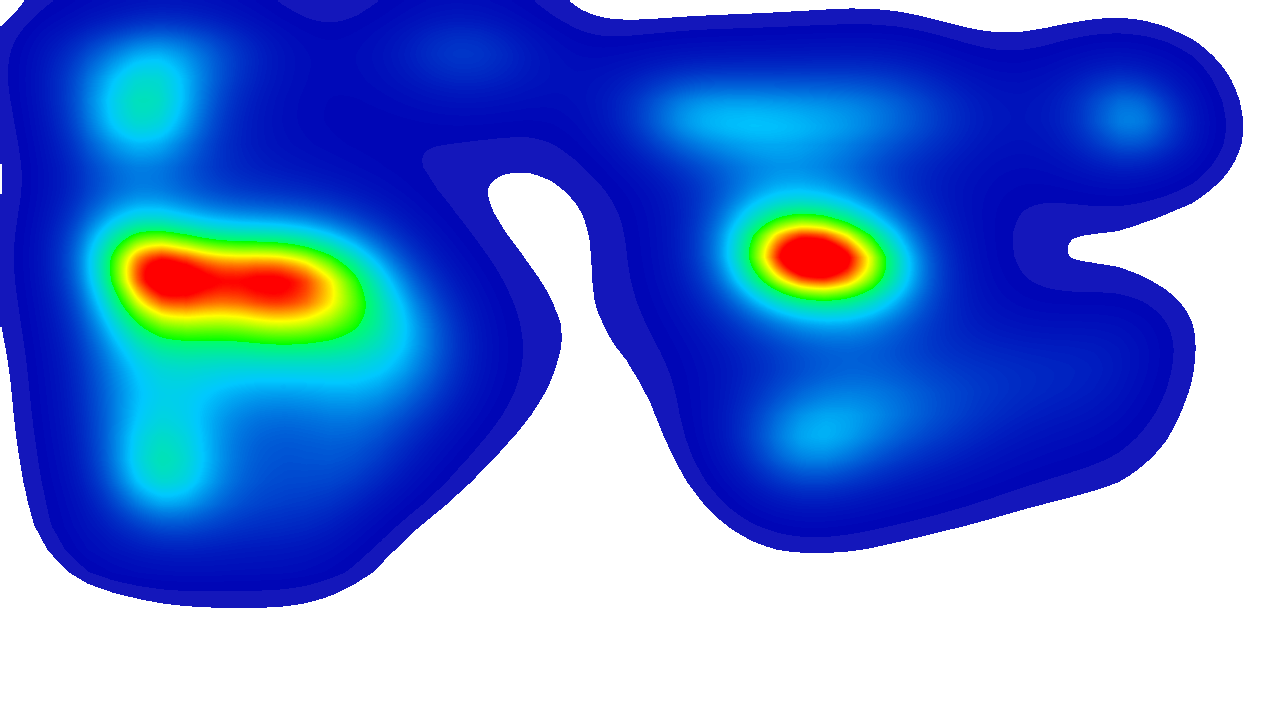
Locate strong and weak areas of predicted attention. Relate them to your message.
Adjust one element, analyze again and compare. Keep your goal in view.
Heatpoints uses UNISAL, a visual saliency model published at ECCV 2020. It gives you an estimate of attention, not a recording of an individual’s gaze.
Explore the scienceSpotting visual competition and discussing hierarchy before publishing.
Comprehension, purchase intent, actual clicks or the order of eye fixations.
No sales call. See a prediction, decide what to adjust, and go back to creating.
Free to try
Upload an image, explore its attention map and download the result. Usage limits apply.
Analyze my imageCompare several imagesMore tools for creative teams are in preparation. Features and prices will be announced when they are available.
No paid offer is presented on this page.
Know what the map tells you. And what it doesn’t.
Read about the modelNo. Heatpoints predicts visual attention from an image using UNISAL. It does not record a person’s eyes. Use it to form design hypotheses, then validate important decisions with real people.
You can start with the free image tool. Usage limits apply. The Chrome extension asks for email verification after its initial free scans. The tool shows you when your allowance is reached.
No. Uploaded images and Chrome captures are sent to the server to calculate the attention map. Check the privacy policy before analyzing confidential material.
Yes. Championship compares multiple images using the same analysis. Open it directly or choose several files in the image tool. Keep the format and purpose comparable to make the results useful.
Not necessarily. Attention does not measure comprehension, preference or intent to purchase. A decorative element may attract attention without helping your message. What matters is where attention goes relative to your goal.
Not yet. For now, export your frame as an image and analyze it on the website. The Chrome extension is available for browser pages.
Your next revision starts with a different perspective.